Glossary
Definitions to common terms you might encounter when using CGM.
Term
Definition
Ambulatory glucose profile (AGP)
Continuous glucose monitoring data are shown visually in the ambulatory glucose profile. A summary of glucose values from the report period (ideally 14 days), with median (50%) and other percentiles are shown as if occurring in a single 24-hour day (midnight to midnight).
AGP Report
Ambulatory glucose profile report: a standardized 1-page continuous glucose monitoring report that provides glycemic activity in both graphical and quantitative formats. This report has 3 components: a table of glucose metrics and targets; the aggregate AGP over 10–14 days; and individual daily views of CGM for the monitoring period.
CGM average glucose
Calculated average (or mean) of daily glucose readings
CGM Standard Deviation (SD)
A statistical measure of the spread in glucose readings around the average. For an individual with glucose readings fluctuating between many highs and lows on a given day, the standard deviation would be relatively high. In contrast, a person whose glucose readings over 24 hours were ‘flat, narrow, and in range’ would have a smaller standard deviation.
Coefficient of variation (%CV)
A metric to describe intraday glycemic variability derived from CGM. %CV is calculated using the equation: [(standard deviation of glucose)/(mean glucose)] x 100. A CV ≤ 36% is considered acceptable; > 36% is considered unstable and an indication for intervention.
Daily glucose profile
On an ambulatory glucose profile report, individual graphs of glucose patterns for each day covered, with normal glucose range, hyper- and hypoglycemic ranges/episodes shaded in different colors.
FNIR
‘Flat, narrow, in range.’ An acronym for a desirable CGM ambulatory glucose profile.
Glucose management indicator (GMI)
Calculated from CGM-derived mean glucose over ~14 days for a given individual. This is a new term for estimating A1C. GMI (%) is calculated using the formula: 3.31 + 0.02392 x [mean glucose in mg/dL]. A GMI calculator is available at: https://www.jaeb.org/gmi/
Glycemic variability (GV)
The degree of fluctuation in blood glucose values over a given time period. The coefficient of variation (%CV) is the metric used to describe intraday glycemic variability derived from CGM. %CV is calculated using the equation: [(standard deviation of glucose)/(mean glucose)] x 100. A target %CV of ≤ 36% is included in the 2021 AACE guidelines as one of the priority metrics for clinical decision making for all persons with diabetes. An increased frequency of hypoglycemia has been reported for patients with type 1 diabetes and individuals with type 2 diabetes on insulin therapy when GV (%CV) is above the threshold of 36%.
Intermittently scanned CGM (isCGM)
The CGM user must scan a receiver, reader, or smart phone over the sensor to obtain glucose data (in contrast to real-time CGM systems that automatically transmit data at an established frequency such as every 5 minutes to the receiver or smartphone). Only the last 8 hours of glucose readings are reported with isCGM devices. [historically referred to as ‘flash’ CGM]
Lag
CGM systems measure glucose levels in interstitial fluid (via sensor placement) and not directly in the blood. When glucose levels change in the blood, it takes time for equilibrium to be reached in the interstitial fluid, therefore there can be a 5–15-minute delay or ‘lag’ between blood glucose measurements and CGM measurements particularly when blood glucose values are changing rapidly.
Percent Time CGM Active
On an ambulatory glucose profile report, the hours the CGM collected data, divided by the number of hours in the report. The recommended target is 70% of data from 14 days. This value provides information on how often the person with diabetes is wearing and using the device.
Personal CGM
CGM devices that are owned by a person with diabetes, which can be used either continuously or intermittently. Patients use the information in real time to make decisions about their diabetes management.
Professional CGM
Clinic-based and owned CGM devices that are placed on the patient in the provider’s office and used on a short-term basis (~3–14 days). Glucose data may be blinded or visible to the person wearing the device. At the end of the recording period, the device is returned to the clinic, glucose data are downloaded, and the information is reviewed with the patient, providing insights to help inform diabetes management.
Real-time CGM (rtCGM)
The CGM device automatically transmits glucose data to the receiver or smart phone.
On an AGP report, the percent of CGM readings and time in hours/minutes of a 24-hour day with glucose > 180 mg/dL (high).
On an AGP report, the percent of CGM readings and time in hours/minutes of a 24-hour day with glucose > 250 mg/dL (very high).
On an AGP report, the percent of CGM readings and time in hours/minutes of a 24-hour day with glucose < 70 mg/dL (low).
On an AGP report, the percent of CGM readings and time in hours/minutes of a 24-hour day with glucose < 54 mg/dL (very low).
On an AGP report, the percent of CGM readings and time in hours and minutes of a 24-hour day with glucose in target range of 70-180 mg/dL for > 70% of the time or ~17 hours per day. On average, for most people, time in range of 70% correlates with an A1C of 7%. [Note: For elderly and individuals at high risk of hypoglycemia, time in range (70-180 mg/dL) may be reduced to > 50% of the time or > 12 hours/day.]>
Trend arrows
Arrows displayed on CGM systems that provide predictive cues about glycemic activity including the direction and speed with which glucose values are changing.
References
- ADCES. ADCES playbook series: implementing CGM into your practice. https://www.diabeteseducator.org/practice/practice-tools/app-resources/professional-cgm-playbook. Accessed Sept 2021.
- Battelino T, et al. Clinical targets for continuous glucose monitoring data interpretation: recommendations from the international consensus on time in range. Diabetes Care. 2019;42:1593-1603.
- Bergenstal RM, et al. Glucose management indicator (GMI): a new term for estimating A1C from continuous glucose monitoring. Diabetes Care. 2018;41:2275-2280.
- Grunberger G, et al. American Association of Clinical Endocrinology clinical practice guideline: the use of advanced technology in the management of persons with diabetes mellitus. Endocrine Practice. 2021;27:505-537.
- International Diabetes Center.
- AGP-Ambulatory Glucose Profile. http://www.agpreport.org/agp/agpreports. Accessed Sept 2021.
- Miller EM. Using continuous glucose monitoring in clinical practice. Clin Diabetes. 2020;38:429-438.
Recommended Clinical Targets for Glycemic Control for Adults With Type 1 or Type 2 Diabetes
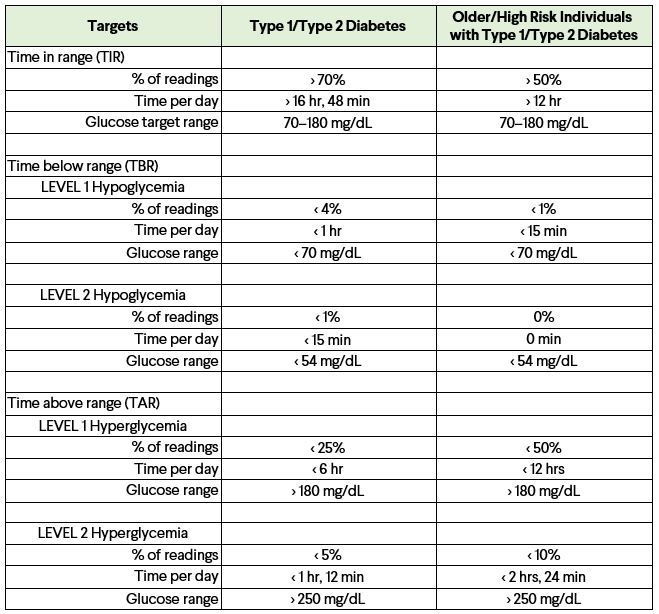
Adapted from Battelino T, et al. Clinical targets for continuous glucose monitoring data interpretation: recommendations from the international consensus on time in range. Diabetes Care. 2019;42:1593-1603.
Download PDF Template